Stay updated with the latest in cryptocurrency and blockchain news, delivered fast and reliably. Bookmark this page and check back often for valuable insights and timely information!
Visualizing the intricate processing power of quantum computing systems. Bitcoin's Quantum Conundrum: Is Your Crypto Safe from Tomorrow's Supercomputers? ⚖️ The cryptocurrency world is no stranger to intense debates, but a new round of discussion is pushing theoretical threats from the lab into everyday market talk: the potential impact of quantum computing on Bitcoin's security. What was once considered a distant sci-fi scenario is now prompting uncomfortable questions about network resilience and long-term investment strategy. As we head deeper into 2025, the conversation has moved from "if" to "when," and more importantly, "how will Bitcoin adapt?" Investors are increasingly grappling with the question of whether this futuristic threat is close enough to influence current market dynamics. While quantum machines r...
Get link
Facebook
X
Pinterest
Email
Other Apps
XRP Price Outlook for 2026: RSI Signals Point To A Completed Dip
Get link
Facebook
X
Pinterest
Email
Other Apps
-
Introductory image depicting XRP's potential for a bright future.
XRP's 2026 Outlook: Technical Signals Hint at a Major Rebound Post-Dip
After weathering a significant downtrend in recent weeks, following what was an undoubtedly bullish cycle earlier in 2025, XRP has once again found itself at a crucial juncture. The crypto market, ever-focused on what lies ahead, is now shifting its attention from short-term volatility to the potential for a substantial recovery and growth into the new year and beyond, particularly eyeing 2026.
XRP Price TrendLast 7 Days
Powered by CryptoCompare
Intriguingly, in-depth technical analysis leveraging indicators like the Relative Strength Index (RSI) suggests that current price action might be meticulously laying the groundwork for XRP to potentially enter a period of strong performance. While the broader market may not yet fully acknowledge these subtle shifts, seasoned analysts are seeing compelling patterns emerge.
📌 Event Background: XRP's Journey Through Volatility and Regulatory Hurdles
⚖️ XRP's trajectory has been a story defined by both groundbreaking utility and persistent regulatory challenges. Its underlying technology, designed for fast and low-cost international payments, has always promised significant disruption to traditional finance. However, the multi-year legal battle with the U.S. Securities and Exchange Commission (SEC) cast a long shadow, suppressing price discovery and dampening investor sentiment.
Despite these headwinds, XRP has demonstrated remarkable resilience. Periods of regulatory clarity, even partial ones, have historically triggered explosive rallies, showcasing the pent-up demand and potential institutional interest that lies beneath the surface. The "bullish cycle earlier in the year" likely refers to one such period, where optimism around further legal developments or broader market momentum temporarily lifted the token.
⚖️ Today, as we head into late 2025, the conversation has evolved. While the SEC case continues to be a backdrop, the market is increasingly mature, and institutional vehicles like Spot XRP ETFs are no longer a distant dream but a tangible possibility being actively discussed. This potential for new capital inflows, coupled with the token's established use case, makes current price movements exceptionally significant for long-term investors.
📌 Market Impact Analysis: Decoding the Signals for 2026
RSI Signals a Completed Dip: A Foundation for Recovery
One of the most compelling arguments for a bullish outlook comes from the 3-day Relative Strength Index (RSI). Prominent analyst Dark Defender has highlighted that XRP's RSI has consistently dropped into a zone historically associated with the completion of price corrections. This pattern was observed in 2024, where similar RSI conditions preceded decisive moves to the upside.
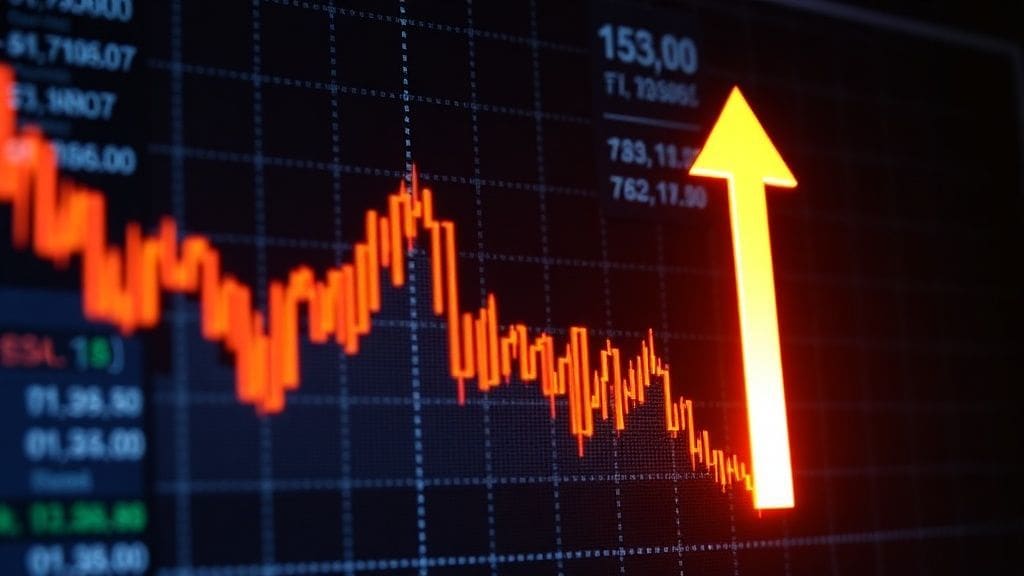
Visualizing the shift from a downtrend to a potential uptrend.
The accompanying technical charts reinforce this perspective, showing XRP stabilizing near a critical horizontal support region. This stabilization, coupled with the RSI flattening near oversold territory, suggests that selling pressure is nearing exhaustion. Even if the price action continues to trade sideways in the immediate short term, this technical setup often precedes a significant market reversal. For investors, this implies that the current levels could represent a strong accumulation zone, rather than a continuation of the downtrend.
Elliott Wave Theory: Projecting a Massive Impulse Rally
Beyond the RSI, XRP's price structure, as analyzed through the lens of Elliott Wave Theory, further strengthens the bullish case. The visual Elliott Wave count on the 3-day timeframe indicates that the recent decline aligns perfectly within a corrective sequence, specifically on a sub-impulse wave 5. This sub-wave is part of a larger fourth impulse wave that initiated as far back as early 2025.
According to Elliott Wave principles, a completed fourth impulse wave is expected to be followed by an expansive impulsive Wave 5, which invariably resolves to the upside. The projected path suggests that a confirmed breakout from this current structure could propel XRP into a massive rally. The specific price target identified by Dark Defender's analysis is around the 2.618 Fibonacci extension, which stands at an ambitious $5.85.
⚖️ This technical confluence of RSI suggesting a completed dip and Elliott Wave predicting an imminent Wave 5 rally provides a powerful narrative for potential upside. Such a rally would not only benefit XRP holders but could also inject significant bullish sentiment across the broader altcoin market, potentially signaling the start of a new mini-cycle for certain sectors.
Contextual Factors: Scarcity and ETF Optimism
Dark Defender also links this technical setup to timing, suggesting that the period around Christmas and the New Year could coincide with improving market sentiment, positioning XRP to "shine after the holidays." This seasonal optimism often plays a role in crypto market dynamics. Moreover, the analyst pointed to "upcoming scarcity" as another factor. This likely refers to the long-term implications of potential Spot XRP ETFs, which could lock up significant supply, creating demand-side pressure that drives prices higher.
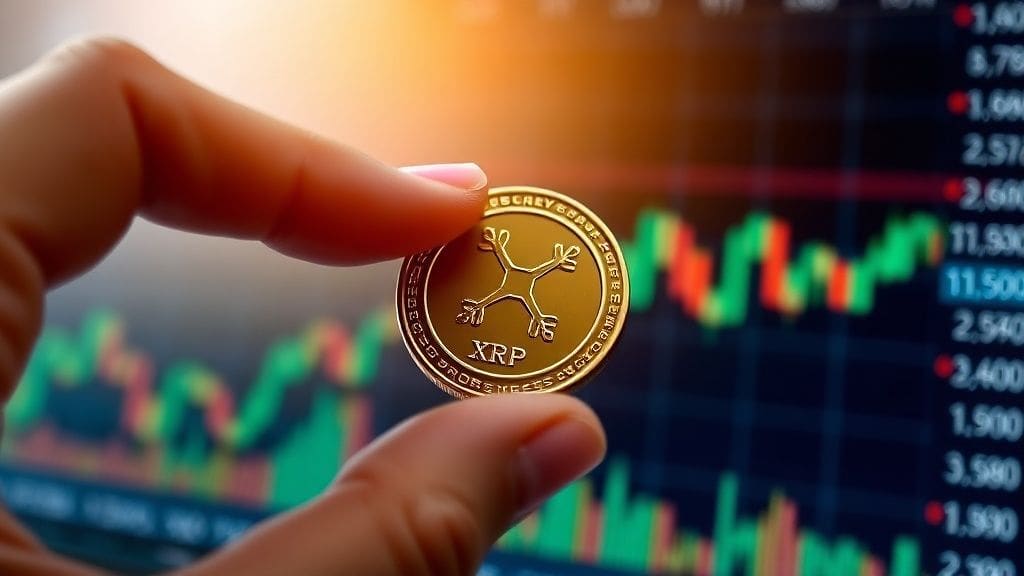
Close-up on XRP holding, with bullish market indicators.
📌 Key Stakeholders’ Positions
Stakeholder
Position/Key Detail
Dark Defender (Analyst)
📈 Identifies current XRP price action as a "completed dip" based on 3-day RSI, setting up for a strong bullish Wave 5 to $5.85.
👥 Retail Investors
📊 Currently divided between caution due to recent downtrend and anticipation for 2026, looking for clear signals of reversal.
👥 🏛️ Institutional Investors
Increasing interest, particularly with discussions around potential Spot XRP ETFs hinting at future scarcity and significant capital inflows.
Ripple (XRP Issuer)
💰 Focused on expanding real-world utility and clarity in the regulatory landscape, which directly impacts XRP's market perception and potential.
The analyst Dark Defender's bullish stance, backed by specific technical indicators, stands in contrast to the short-term caution of many retail investors who have experienced the recent downtrend. However, the growing narrative around XRP ETFs and potential scarcity aligns the interests of long-term holders and institutions, suggesting that fundamental factors are catching up to the technical predictions. This interplay of technical prowess and fundamental catalysts creates a potentially explosive scenario for investors.
📌 Future Outlook: Navigating the Road to $5.85 and Beyond
🚀 The path forward for XRP appears increasingly defined by a blend of technical resilience and evolving market dynamics. Should the forecasted Wave 5 materialize, XRP could experience a substantial rally, potentially reaching the $5.85 target and establishing new all-time highs. This would undoubtedly generate significant interest, drawing both new capital and renewed speculation.
The development of Spot XRP ETFs remains a pivotal long-term catalyst. Approval of such a product would not only legitimize XRP further in the eyes of traditional finance but also provide a regulated, accessible avenue for institutional investment, creating sustained demand. While regulatory clarity is always a consideration for XRP, the market in 2025 is more adept at pricing in potential outcomes.
For investors, this outlook presents both opportunities and risks. The opportunity lies in the potential for significant capital appreciation if these technical signals and fundamental catalysts converge. The risk, as always, is that technical patterns can fail, and regulatory hurdles, though diminishing, can still introduce volatility. However, the current confluence of indicators suggests that XRP is in a strong position to build a base for a powerful upward movement into 2026.
📌 🔑 Key Takeaways
RSI Signals Bottom: The 3-day Relative Strength Index (RSI) for XRP indicates a completed dip, historically preceding significant price recoveries.
Elliott Wave Target: Technical analysis suggests XRP is poised for an impulsive Wave 5 rally, with a potential target of $5.85 based on the 2.618 Fibonacci extension.
Strategic Timing: The period around year-end and early 2026 is highlighted as a potential timeframe for improving sentiment and a significant price surge.
ETF Catalyst: Discussions around potential Spot XRP ETFs are contributing to long-term scarcity narratives and could drive institutional demand.
🔮 Thoughts & Predictions
As we close out 2025, the market's attention on XRP is shifting from the recent slump to its robust technical underpinnings. The confluence of a 3-day RSI signaling a 'completed dip' and the compelling Elliott Wave Theory projection for an impulsive Wave 5 suggests that XRP is currently in a critical accumulation phase, ripe for a substantial upward movement into 2026. This isn't just wishful thinking; it's a pattern that has delivered significant returns historically.
Illustrating the RSI indicator signaling a completed price correction.
From my perspective, the narrative of "upcoming scarcity" tied to Spot XRP ETFs is gaining serious traction and provides a fundamental tailwind that perfectly complements the bullish technical outlook. A confirmed breakout from current stabilization levels could trigger a rapid revaluation towards the $5.85 target, representing a staggering multi-fold increase from current prices. This move would likely not be linear, but the foundational support and institutional interest suggest a more sustainable trajectory than previous speculative pumps.
While market volatility always remains a factor, the indicators are clear: XRP is building a formidable base. Investors should be prepared for potentially explosive price action in the medium-term, particularly as we move past the holiday season and into Q1 2026. The window for strategic positioning at these levels may be closing faster than many realize.
🎯 Investor Action Tips
Monitor Key Support: Closely watch the $1.86 to $1.90 range and the $1.8815 (1.618 Fibonacci) level for sustained support, as a breach could invalidate immediate bullish projections.
Track ETF Developments: Stay updated on news regarding Spot XRP ETF applications and approvals, as this will be a major catalyst for long-term price action and scarcity.
Analyze Volume on Breakout: Look for significant trading volume accompanying any breakout above recent resistance levels to confirm the strength of the bullish move.
Consider Dollar-Cost Averaging (DCA): For long-term investors, consider using a DCA strategy around current price levels to average into a position ahead of a potential Wave 5 rally.
📘 Glossary for Serious Investors
📈 Relative Strength Index (RSI): A momentum oscillator used in technical analysis that measures the speed and change of price movements. It ranges from 0 to 100, typically indicating overbought conditions above 70 and oversold conditions below 30.
🌊 Elliott Wave Theory: A technical analysis tool that proposes market prices move in recognizable wave patterns (impulses and corrections) that reflect investor psychology, often predicting future price movements based on fractal patterns.
📐 Fibonacci Extension: A tool used by technical analysts to project potential price targets or resistance levels beyond established highs or lows, based on the Fibonacci sequence. The 2.618 extension is a common, more aggressive target.
🧭 Context of the Day
XRP's deeply oversold technicals and looming ETF catalysts signal a pivotal moment for investors eyeing significant long-term gains in 2026.
📈 RIPPLE Market TrendLast 7 Days
Date
Price (USD)
7D Change
12/16/2025
$1.90
+0.00%
12/17/2025
$1.93
+1.73%
12/18/2025
$1.86
-1.85%
12/19/2025
$1.81
-4.70%
12/20/2025
$1.91
+0.49%
12/21/2025
$1.93
+1.85%
12/22/2025
$1.92
+1.38%
12/23/2025
$1.90
+-0.00%
Data provided by CoinGecko Integration.
💬 Investment Wisdom
"The best time to buy is when there's blood in the streets." — Baron Rothschild
Digital asset forecast analyzing upcoming volatility: crypto market, next bull run, BTC price. Bitcoin's "Moonvember" Hopes Tempered by Market Realities: A Deep Dive for Investors 📌 Navigating Bitcoin's November Crossroads: Will History Repeat? The cryptocurrency market is at a fascinating juncture as we enter November 2025. Bitcoin, fresh off a somewhat disappointing "Uptober" where it retraced over 10% after briefly touching $126,000 , faces a pivotal month. Historically, November, often referred to as "Moonvember," has been a strong period for Bitcoin. But can historical trends overcome current market headwinds? To understand the present, it's essential to acknowledge the past. Bitcoin's price action has often followed predictable seasonal patterns. October and November, in particular, have been associated with bullish...
Tokenization boom accelerates: XRP ecosystem integrates $50T property. RWA crypto, digital assets, blockchain real estate. Epic Chain's XRP Integration: A Trillion-Dollar RWA Opportunity? 🔗 Epic Chain, a project supported by Ripple, is making significant strides in the tokenization of real-world assets (RWAs) by leveraging the XRP Ledger. This initiative aims to bring trillions of dollars worth of assets onto the blockchain, potentially revolutionizing how real estate, credit, commodities, and collectibles are managed and traded. But what does this mean for crypto investors? 📌 Ripple's Backing and Epic Chain's RWA Platform Epic Chain is positioning itself at the forefront of the RWA tokenization movement with its XRP-native platform. The platform is designed to facilitate the transfer of real estate, credit, commodities, and collectibles onto the XRP Ledg...
Crypto market sentiment shifts as BlackRock ETF inflows impact Bitcoin, fueling institutional adoption and digital asset control debates. Decoding Simon Dixon's Warning: Is BlackRock Orchestrating a Bitcoin Grab? Veteran Bitcoiner Simon Dixon, co-founder of Bank to the Future, recently issued a stark warning about what he perceives as a "Wall Street attack phase" on Bitcoin. Speaking with Bitcoin Archive's Archie, Dixon argued that institutional finance is constructing systems to draw customer coins into custodial environments, potentially separating investors from their Bitcoin during crises. His core message: Bitcoin's strength lies in self-custody, where individuals control their money and benefit from its fixed supply. But how real is this threat, and what should investors do? 📌 The Alleged BlackRock Bitcoin Control Scheme 💧 Dixon's nar...