Stay updated with the latest in cryptocurrency and blockchain news, delivered fast and reliably. Bookmark this page and check back often for valuable insights and timely information!
The urgency behind the Warsh nomination signals a strategic doctrinal shift within the Federal Reserve hierarchy. Fed Pivot & LiquidChain: The Institutional Playbook for Crypto's Next Frontier 🏦 The whispers from Washington are getting louder, and any seasoned investor knows what that means: a seismic shift is brewing. Forget the daily market noise. We’re witnessing the strategic repositioning of institutional power players, and it’s set to redefine how capital flows into digital assets. This isn't just about a new name at the Federal Reserve; it’s about a deliberate reset of the entire financial playbook. ⚖️ Treasury Secretary Bessent isn't just making small talk with Fox News. His push for Kevin Warsh's swift confirmation to the Federal Reserve Board is a clear signal. This isn't bureaucratic routine; it's a calculated move to...
Get link
Facebook
X
Pinterest
Email
Other Apps
Bitcoin $60,000 crash is 9th largest: $42k floor is market's reckoning
Get link
Facebook
X
Pinterest
Email
Other Apps
-
Bitcoin navigates a treacherous path, with experts warning its current recovery phase may prove fleeting.
Bitcoin's Latest Plunge: Not Just a Dip, But a Deeper Market Reckoning
🚩 The Latest Bloodbath Deja Vu But Different
🏆 Here we are again. Bitcoin (BTC) just shed over 52% from its recent all-time high (ATH) of $126,000, plummeting to $60,000. For the uninitiated, this might look like a catastrophic failure. For veterans like us, it's merely the 9th largest drawdown in Bitcoin's history, as some observers are quick to point out.
BTC Price TrendLast 7 Days
Powered by CryptoCompare
But let's be clear: reducing this to a simple percentage overlooks the profound shifts happening beneath the surface. This isn't just another retail flush; it's a test of the newfound institutional muscle in the crypto market.
The $42,000 price point looms as a critical psychological and structural test for Bitcoin's stability.
📍 A Historical Perspective When Bitcoin Bleeds
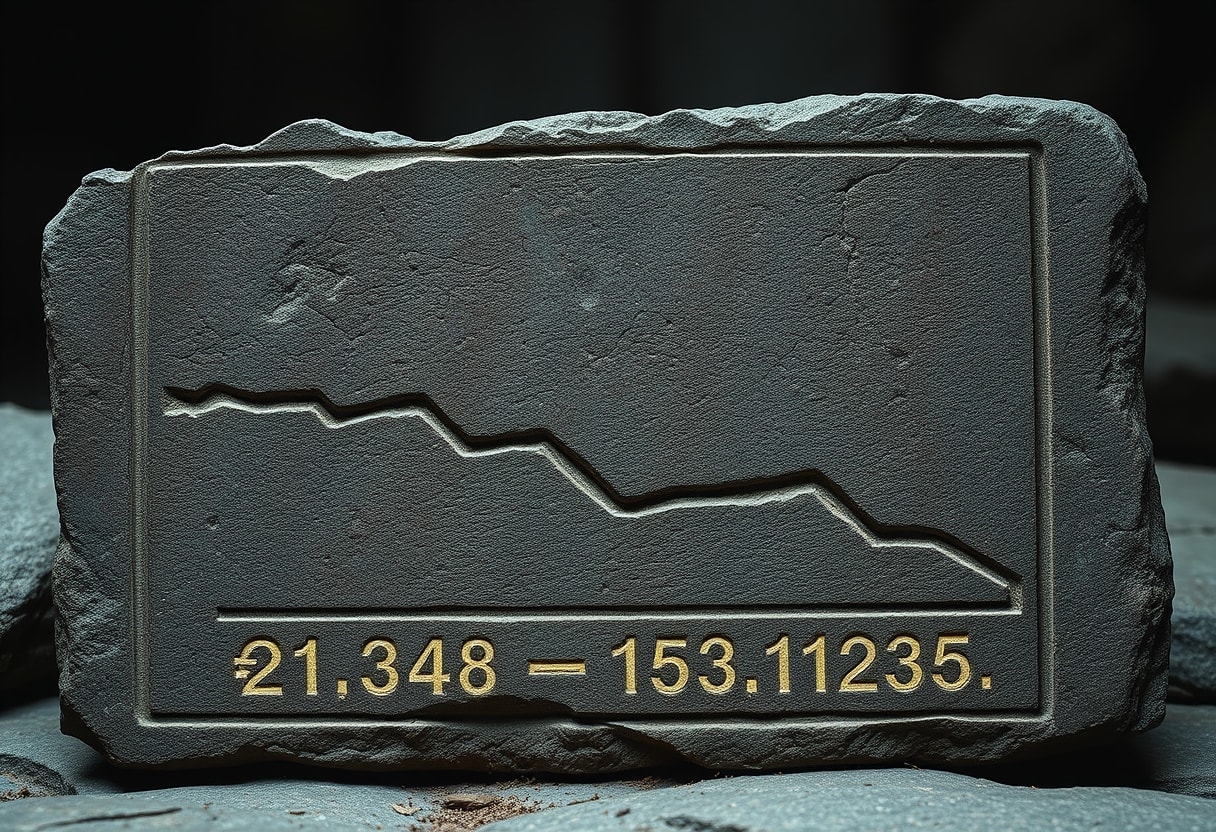
🐻 Bitcoin's journey has been punctuated by brutal corrections. Flashbacks to the early days reveal truly staggering percentage drops. In 2011, BTC collapsed by 94% from $32 to $2. The 2013-2015 bear market saw an 87% fall from $1,160 to $152. Even the infamous 2017-2018 run-up ended in an 84% crash from $19,600 to $3,100.
More recently, the peak of $69,000 to $15,500 was a devastating blow. Each of these events, while painful, served as a cleansing mechanism, washing out overleveraged positions and weak hands. They've been part of Bitcoin's volatile, yet ultimately upward, trajectory.
Decoding the Drawdowns: Beyond the Numbers
The current 52% drawdown might seem tame by historical standards. However, it’s occurring in a vastly different market landscape. This isn't the wild west of 2011 or the retail-driven frenzy of 2017.
Today, regulated Spot Bitcoin ETFs wield significant influence, bringing in institutional capital and a new class of investors. Their participation changes the game, adding weight to both rallies and corrections. The market is maturing, which means these corrections are less about existential threats and more about major players repositioning.Historical data etched into market memory reveals the significant past volatility in Bitcoin's price trajectory.
🚩 Stakeholder Views & The Echoes of 2018
➕ The current market dynamics force us to examine who stands to gain and lose. While retail investors often panic, institutional players often view these dips as opportunities for accumulation. This dynamic isn't new; it's a pattern etched into financial history.
🏃 Let's cast our minds back to the 2018 Crypto Winter. That year, following the euphoric 2017 bull run, Bitcoin plunged from nearly $20,000 to just over $3,000. The market was dominated by retail enthusiasm and largely unregulated ICOs. Regulatory bodies were just starting to pay attention, often with heavy-handed warnings rather than clear guidance.
🩸 The outcome was a brutal, extended bear market. Many retail investors capitulated, selling at significant losses. The lesson learned was harsh: speculation without foundational infrastructure is a house of cards. Yet, during this period, smart money quietly entered, building infrastructure, and accumulating assets at fire-sale prices.
🌊 In my view, this current dip, while less severe in percentage, carries a different kind of weight. Unlike 2018, where regulatory uncertainty was paralyzing, today we have clearer—albeit imperfect—regulatory frameworks and significant institutional adoption, particularly through ETFs. This isn't just about fear; it's about re-evaluation. The "big players" are testing the new liquidity and gauging retail resilience, pushing prices down to find optimal entry points. This appears to be a calculated move to shake out marginal buyers and consolidate control.
Summary of Key Stakeholder Positions
Stakeholder
Position/Key Detail
Swan CEO Cory Klippsten
Highlights this as 9th largest BTC crash, noting historical context of larger percentage drawdowns.
Veteran Trader Peter Brandt
🔻 Predicts the sell-off may not be over, possibly dropping to a $42,000 floor marking a bottom based on past cycles.
Crypto Analyst Michaël van de Poppe
Identifies a "capitulation candle" on weekly charts, suggesting buying pressure and a potential bottom range of $65,000-$70,000 before a possible rally to $85,000.
📍 Decoding the Market Signals Capitulation or Consolidation
🌠 When the charts paint a grim picture, it's easy to fall prey to fear. However, seasoned analysts are quick to point out nuances. The concept of a "capitulation candle" on weekly charts, as one prominent analyst highlighted, suggests a rapid, heavy sell-off followed by a swift rebound.
Bitcoin's journey has been marked by several significant, deep drawdowns, each testing market resilience.
This rebound, pushing Bitcoin back above $70,000, indicates significant underlying buying pressure. It suggests that while some are panic-selling, others are eagerly accumulating. The battle lines are drawn around the $65,000-$70,000 range, which some believe is the bottom area for the immediate future. Still, the prospect of a deeper dip to $42,000 lingers as a worst-case scenario.
🟢 The market is currently trading around $71,000, showing a modest bounce. This isn't a V-shaped recovery, but a cautious consolidation. The $69,000 level, the 2021 ATH, remains a critical psychological and technical support that bulls are desperately trying to defend.
🚩 Market Impact & The Road Ahead
Short-term, we're staring down continued volatility. Investor sentiment remains fragile, oscillating between fear of further downside and FOMO for potential recovery. This whipsaw action is a classic maneuver by larger entities to create maximal discomfort and shake out retail participants.
Longer-term, such corrections, especially when met with institutional buying, tend to strengthen the underlying asset. They flush out excess leverage and reset market expectations. The narrative shifts from "get rich quick" to "slow and steady accumulation," benefiting those with conviction and capital.
🏛️ For sectors like stablecoins, this volatility could see increased demand as investors seek safer havens within crypto. DeFi protocols might see a dip in Total Value Locked (TVL) due to liquidations, but robust projects with strong fundamentals could emerge stronger. NFTs, being more speculative, will likely experience continued contraction unless tied to utility or strong communities.
Despite recent moves, experts caution that Bitcoin's current market turbulence may yet escalate further.
📝 Key Takeaways
Bitcoin's recent 52% drop, while significant, is historically not its worst, yet reflects a maturing market with increased institutional influence.
Expert opinions are split, with some anticipating a potential bottom as low as $42,000, while others identify a capitulation event suggesting a bottom around $65,000-$70,000.
The current market behavior draws parallels with the 2018 Crypto Winter, but with crucial differences in market structure, regulatory clarity, and institutional participation.
Investor sentiment remains volatile, highlighting the need for strategic positioning rather than emotional reactions.
🔮 Thoughts & Predictions
The current Bitcoin dip is not merely a rerun of past bear cycles. Unlike the retail-driven capitulation of the 2018 Crypto Winter, where widespread fear paralyzed investors and regulations were nascent, today's landscape is fundamentally different. This plunge, while painful, is occurring in a market with regulated Spot ETFs and substantial institutional capital on the sidelines. The smart money, having observed the slow accumulation during the 2018 downturn, is likely using this volatility to actively buy into weakness, potentially aiming for a retest of the $60,000 level before any significant upward movement.
We're not just seeing a price correction; we're witnessing a redistribution of Bitcoin from less-resilient holders to those with deeper pockets and longer time horizons. The chatter of a $42,000 floor, while a possibility, serves more as a psychological anchor to test conviction than a firm prediction. Expect a prolonged period of consolidation in the $60,000-$75,000 range, with intermittent tests of lower support, as institutions methodically build their positions before the next major bull leg, which could realistically see BTC break past $150,000 by year-end.
The bottom line is that the market is showing its teeth, but it's a calculated bite. This current phase is crucial for long-term investors, distinguishing between those who understand market cycles and those who chase pumps.
🎯 Investor Action Tips
Monitor the $60,000 support level closely; a sustained break below could signal further downside to the $42,000 psychological floor.
Consider a dollar-cost averaging (DCA) strategy to accumulate Bitcoin during this consolidation phase, particularly if prices dip into the $60,000-$65,000 range.
Diversify your portfolio across different crypto assets and traditional assets to mitigate risk, especially during periods of high Bitcoin volatility.
Prioritize capital preservation; ensure you're not overleveraged and have sufficient stablecoin reserves to capitalize on potential further dips or market opportunities.
📘 Glossary for Serious Investors
📉 Capitulation Candle: A term used in technical analysis describing a large red candlestick (or a swift, deep price drop) on a chart, typically indicating a rapid sell-off by investors who have given up hope, often marking a market bottom before a rebound.
⬆️ All-Time High (ATH): The highest price an asset has ever traded at in its history, often serving as a significant psychological and technical resistance level once broken.
🧭 Context of the Day
Today's Bitcoin plunge is a calculated institutional test of market resolve, setting the stage for strategic accumulation rather than a pure bear market.
📈 BITCOIN Market TrendLast 7 Days
Date
Price (USD)
7D Change
2/3/2026
$78,767.66
+0.00%
2/4/2026
$75,638.96
-3.97%
2/5/2026
$73,172.29
-7.10%
2/6/2026
$62,853.69
-20.20%
2/7/2026
$70,523.95
-10.47%
2/8/2026
$69,296.81
-12.02%
2/9/2026
$68,411.62
-13.15%
Data provided by CoinGecko Integration.
💬 Investment Wisdom
"History doesn't repeat itself, but it often rhymes." — Mark Twain
Digital asset forecast analyzing upcoming volatility: crypto market, next bull run, BTC price. Bitcoin's "Moonvember" Hopes Tempered by Market Realities: A Deep Dive for Investors 📌 Navigating Bitcoin's November Crossroads: Will History Repeat? The cryptocurrency market is at a fascinating juncture as we enter November 2025. Bitcoin, fresh off a somewhat disappointing "Uptober" where it retraced over 10% after briefly touching $126,000 , faces a pivotal month. Historically, November, often referred to as "Moonvember," has been a strong period for Bitcoin. But can historical trends overcome current market headwinds? To understand the present, it's essential to acknowledge the past. Bitcoin's price action has often followed predictable seasonal patterns. October and November, in particular, have been associated with bullish...
Introducing Solana's pivotal network upgrade, symbolizing growth and advancement. Solana's Alpenglow Upgrade: A Game-Changer for On-Chain Trading and Network Stability 🔗 Solana, a network long celebrated for its blistering speed and low transaction fees, has also navigated its share of stability challenges. As we move into 2025, a critical evolution is on the horizon: the Alpenglow consensus overhaul . This isn't just another incremental update; it's a fundamental reimagining of Solana's core architecture, poised to address longstanding concerns regarding validator performance, network stability, and long-term scalability. For investors, understanding this seismic shift is paramount, as it could significantly redefine SOL's competitive edge and its role within the broader blockchain ecosystem . 📌 🚀 The Alpenglow Evolution: Diving ...
Solana market cap sees massive growth, institutional buying accelerates. SOL investment, crypto portfolio. Solana ETFs Surge: SOL Emerges as Crypto's Third Major Player 📌 Event Background and Significance 🎨 Solana (SOL) has long been touted as a potential "Ethereum killer," offering faster transaction speeds and lower costs. While it has enjoyed periods of popularity, particularly during the NFT boom, it has also faced challenges, including network outages and questions about its decentralization. The approval and subsequent success of Solana Spot Exchange-Traded Funds (ETFs) mark a significant milestone for the cryptocurrency, potentially solidifying its position among institutional investors . Previously, only Bitcoin and Ethereum had achieved this level of mainstream financial product integration. The arrival of Solana ETFs represents a broadening ac...