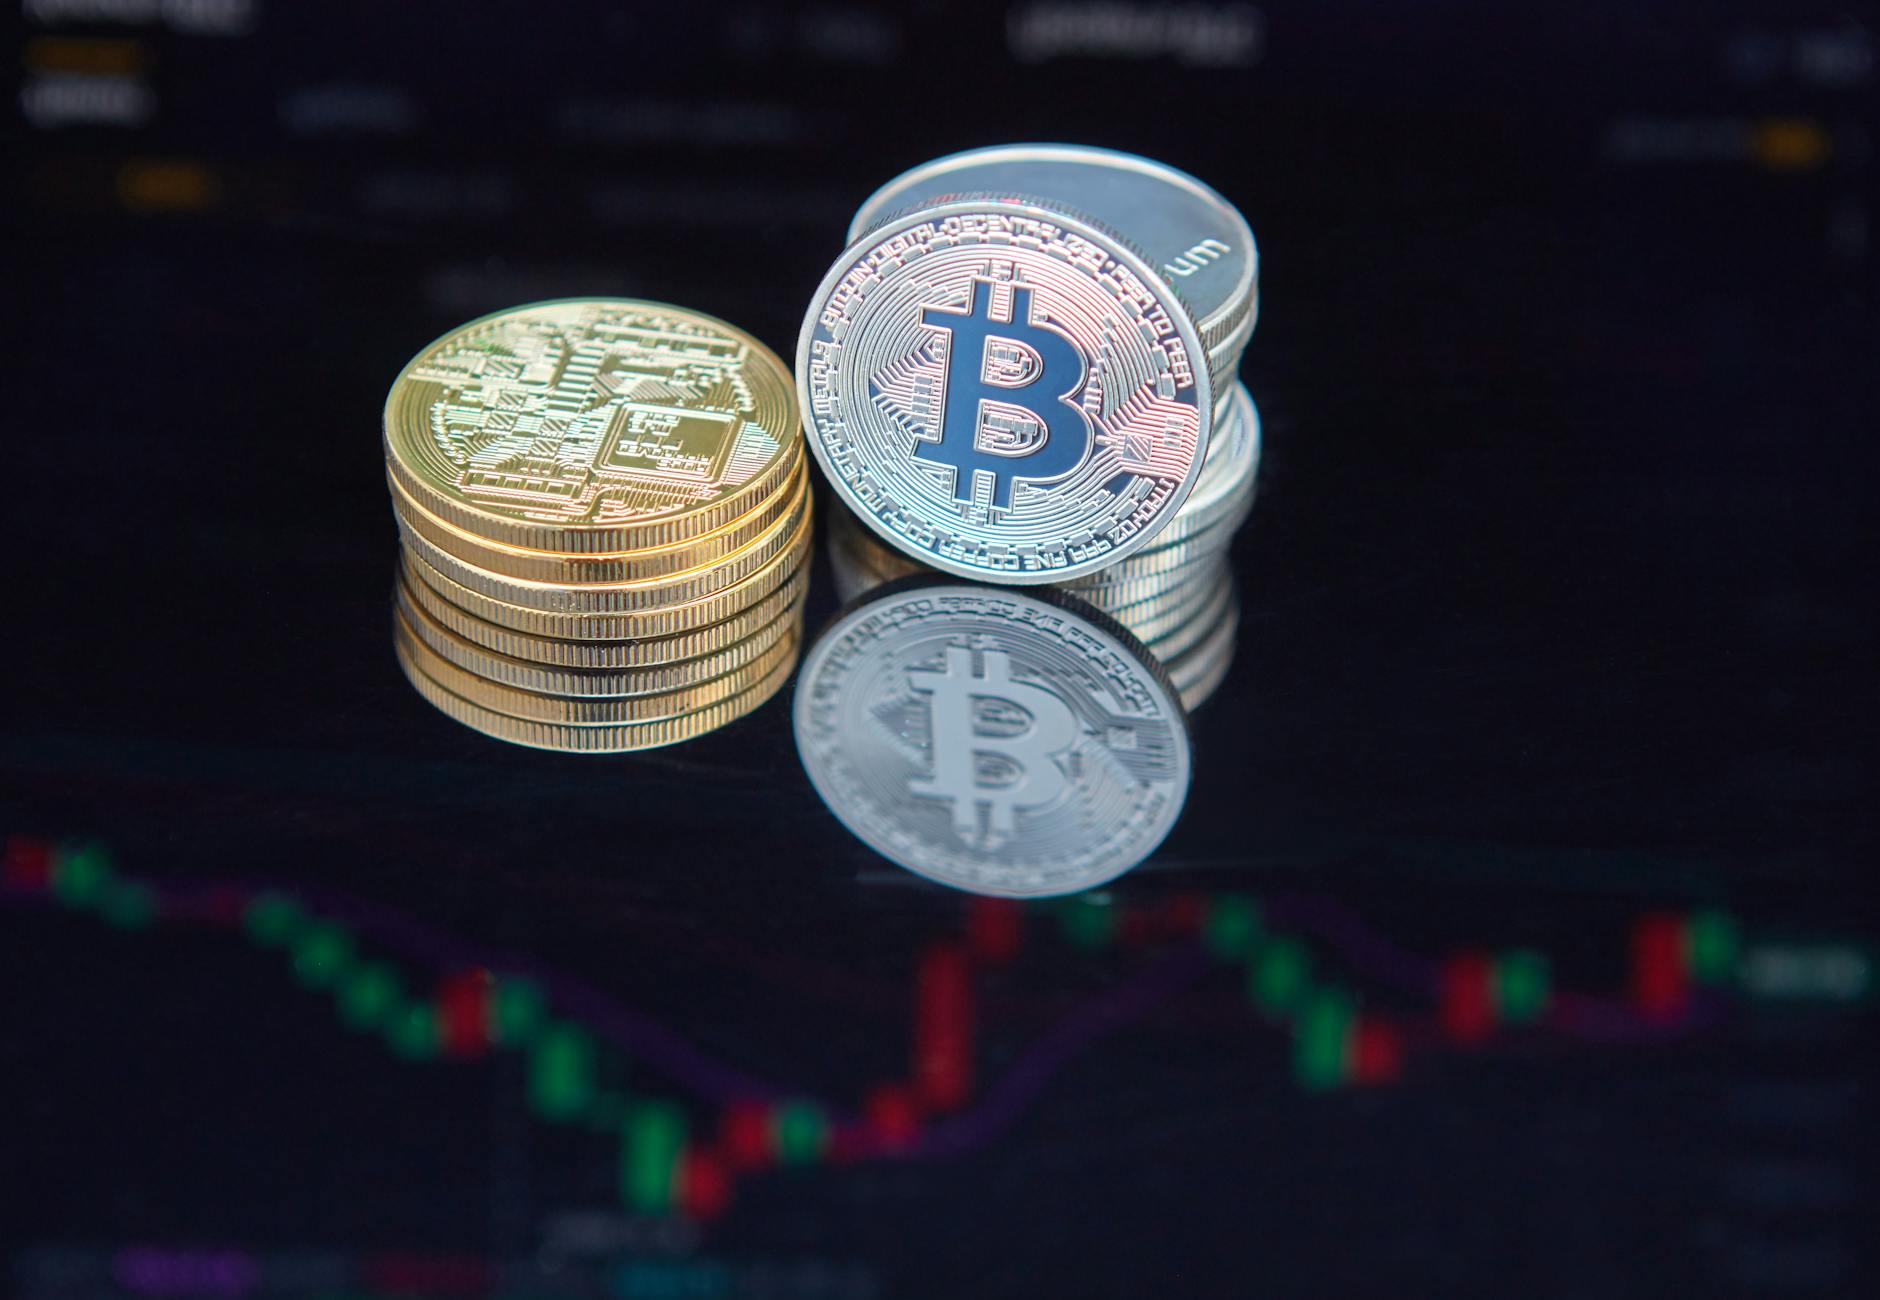
XRP price action sets bullish destiny: Short-term dip, long-term gains
- Get link
- X
- Other Apps

XRP Price Primed for Potential Bull Run: Analyzing Short-Term Scenarios for Long-Term Gains
📌 Analyzing XRP's Current Market Position
Recent analysis indicates that XRP is currently trading around the $2.80 level, exhibiting a structure that has historically foreshadowed significant price movements. While short-term fluctuations may occur, the overall outlook remains bullish. This blog post will delve into the technical analysis supporting this forecast, exploring potential scenarios and their implications for investors. We will examine the factors influencing XRP's price action and provide insights to help you navigate potential market volatility.
📌 Bullish Technical Analysis: Unpacking the Signals
💱 XRP's recent price action has seen it oscillating around the $2.80 mark, repeatedly testing resistance at $2.88 and support at $2.71 without a definitive breakout. This consolidation period follows months of volatility, including a retracement below $3 in September. Despite this, technical indicators suggest underlying strength.
Hidden Bullish Divergence
A key observation is the appearance of hidden bullish divergence on the Relative Strength Index (RSI).
This signal suggests that, despite the recent price downtrend, there's an underlying buying pressure that could propel XRP upwards. The analyst highlighted that XRP closed just over $2.80 in the latest three-day candlestick session.
🔥 This pattern is consistent with XRP's behavior since breaking away from the $0.50 price range, indicating a potential setup for a substantial bullish move. The immediate trajectory, however, hinges on the upcoming weekly close.
📌 Two Potential Paths Forward
The analysis outlines two potential short-term scenarios, both ultimately leading to a bullish outcome for XRP.
Scenario 1: The "April 7th Moment"
This scenario draws a parallel to an event on April 7th, when XRP experienced a sharp dip, briefly breaching the $2 support level and bottoming out at $1.79. This dip served as a retest of its ascending support line before a strong rebound in the following weeks.
A similar move now would see XRP retreating towards the trend line, potentially reaching around $2.40 (as indicated by the pink circle in the referenced chart). This would effectively reset momentum before the next leg of the rally.
Scenario 2: Direct Continuation
Alternatively, if the $2.72 support zone holds firm, XRP could rebound directly from its current price, reclaiming levels above $2.90 and $3.00 sooner. This scenario represents a more immediate continuation of the bullish trend, with buyers aggressively defending the current support level.
While the immediate price action differs between these two scenarios, both pathways ultimately converge on a bullish trajectory for XRP. Currently, XRP is trading at approximately $2.88.
📌 Stakeholder Positions
| Stakeholder | Position | Impact on Investors |
|---|---|---|
| Technical Analysts | 📈 Bullish long-term, potential short-term dip | Opportunity to buy the dip, manage risk |
| XRP Holders | Optimistic, watching support levels | Potential for gains, need for vigilance |
📌 🔑 Key Takeaways
- The analyst's chart review shows XRP holding steady around the $2.80 level, forming a structure that has historically preceded bigger moves. Investors should monitor these historical patterns for potential buy signals.
- The altcoin closed just over $2.80 in the latest three-day candlestick session, which coincided with the appearance of hidden bullish divergence on the chart’s relative strength index (RSI), signaling underlying strength in spite of the most recent price downtrend. This suggests that despite recent price dips, the underlying momentum is bullish.
- There are two possible short-term scenarios, "April 7th moment" (a price dip to around $2.40) and a direct continuation of a rally, both leading to the same bullish conclusion in the long run. Investors should be prepared for short-term volatility while maintaining a long-term bullish outlook.
The bullish signals for XRP, while promising, require a nuanced understanding of market dynamics. I believe the "April 7th moment" scenario is more likely, offering a strategic buying opportunity around the $2.40 level. This dip, while potentially unsettling, would allow XRP to gather momentum for a sustained climb toward $3.50 by Q1 2026, contingent upon broader market sentiment and Ripple's ongoing legal developments. It's critical to recognize that these scenarios are based on technical analysis and historical patterns, which are not foolproof predictors.
- Set buy orders around $2.40 to capitalize on the potential "April 7th moment" dip.
- Monitor the $2.72 support level closely; a firm hold suggests a direct continuation scenario and may warrant adjusting your strategy.
- Implement stop-loss orders below $2.40 to manage downside risk in case the dip is more severe than anticipated.
- Track the RSI (Relative Strength Index) on the three-day candlestick chart for confirmation of bullish divergence and strength signals.
⚖️ RSI (Relative Strength Index): A momentum indicator used in technical analysis that measures the magnitude of recent price changes to evaluate overbought or oversold conditions in the price of a stock or asset.
— John Templeton
Crypto Market Pulse
September 30, 2025, 23:40 UTC
Data from CoinGecko
| Date | Price (USD) | Change |
|---|---|---|
| 9/24/2025 | $2.83 | +0.00% |
| 9/25/2025 | $2.93 | +3.52% |
| 9/26/2025 | $2.74 | -3.18% |
| 9/27/2025 | $2.79 | -1.51% |
| 9/28/2025 | $2.81 | -0.75% |
| 9/29/2025 | $2.86 | +1.27% |
| 9/30/2025 | $2.88 | +1.87% |
| 10/1/2025 | $2.84 | +0.42% |
▲ This analysis shows RIPPLE's price performance over time.
This post builds upon insights from the original news article, offering additional context and analysis. For more details, you can access the original article here.
- Get link
- X
- Other Apps

